October 29, 2026



You probably look at your pricing data to answer some simple questions:
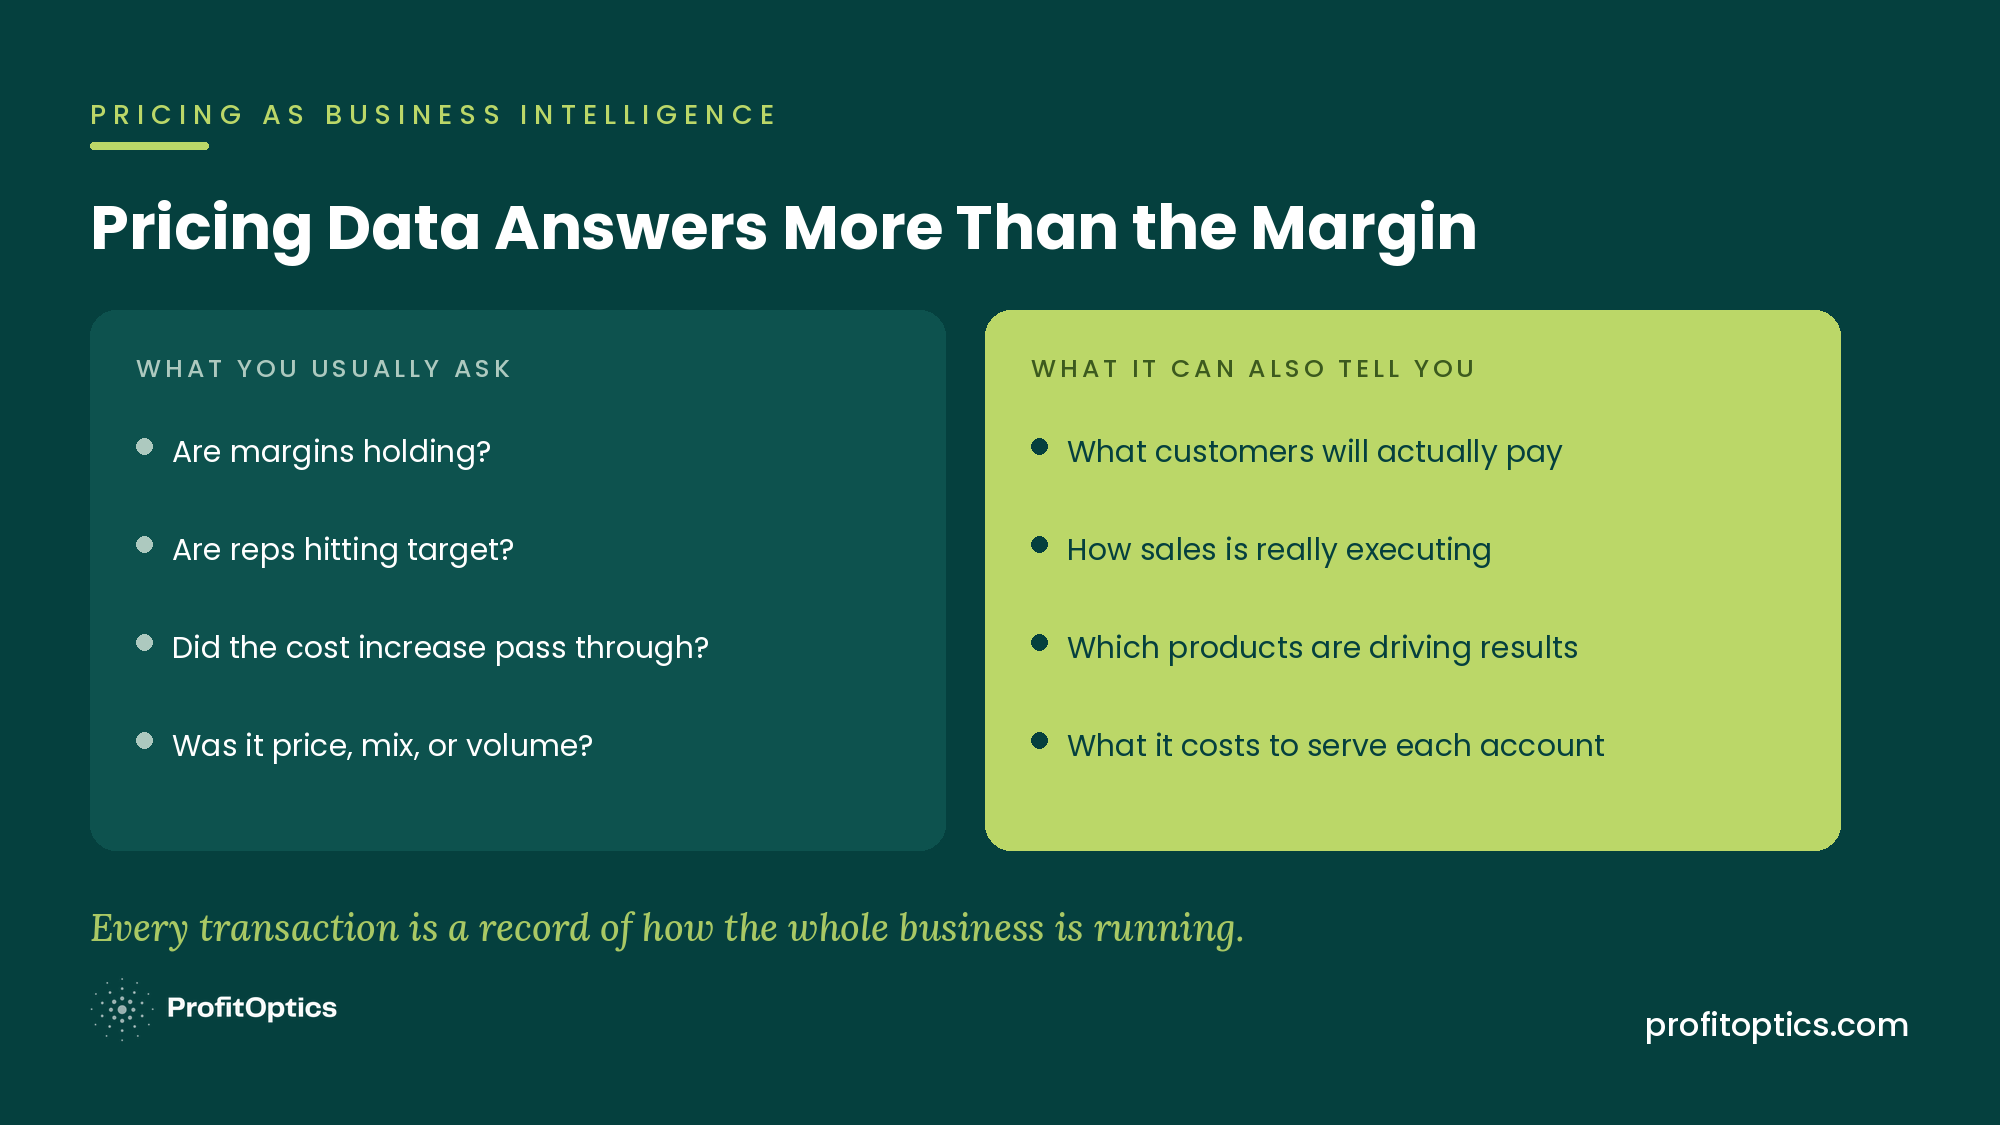
But pricing data also reflects what is happening across the business. Every transaction captures what a customer bought, what they were willing to pay, what sales agreed to, which products moved, and where exceptions were made along the way.
That gives the data value for the entire organization.
Pricing is one of the closest levers to your P&L statement and, as we’ve talked about before, reaches into merchandising, sourcing, operations, sales, and finance functions. Looking at the results can help explain why margins, changed, where customer behavior is shifting, how sales is executing, and where other parts of the business may deserve a closer look.
Here are a few places to start.
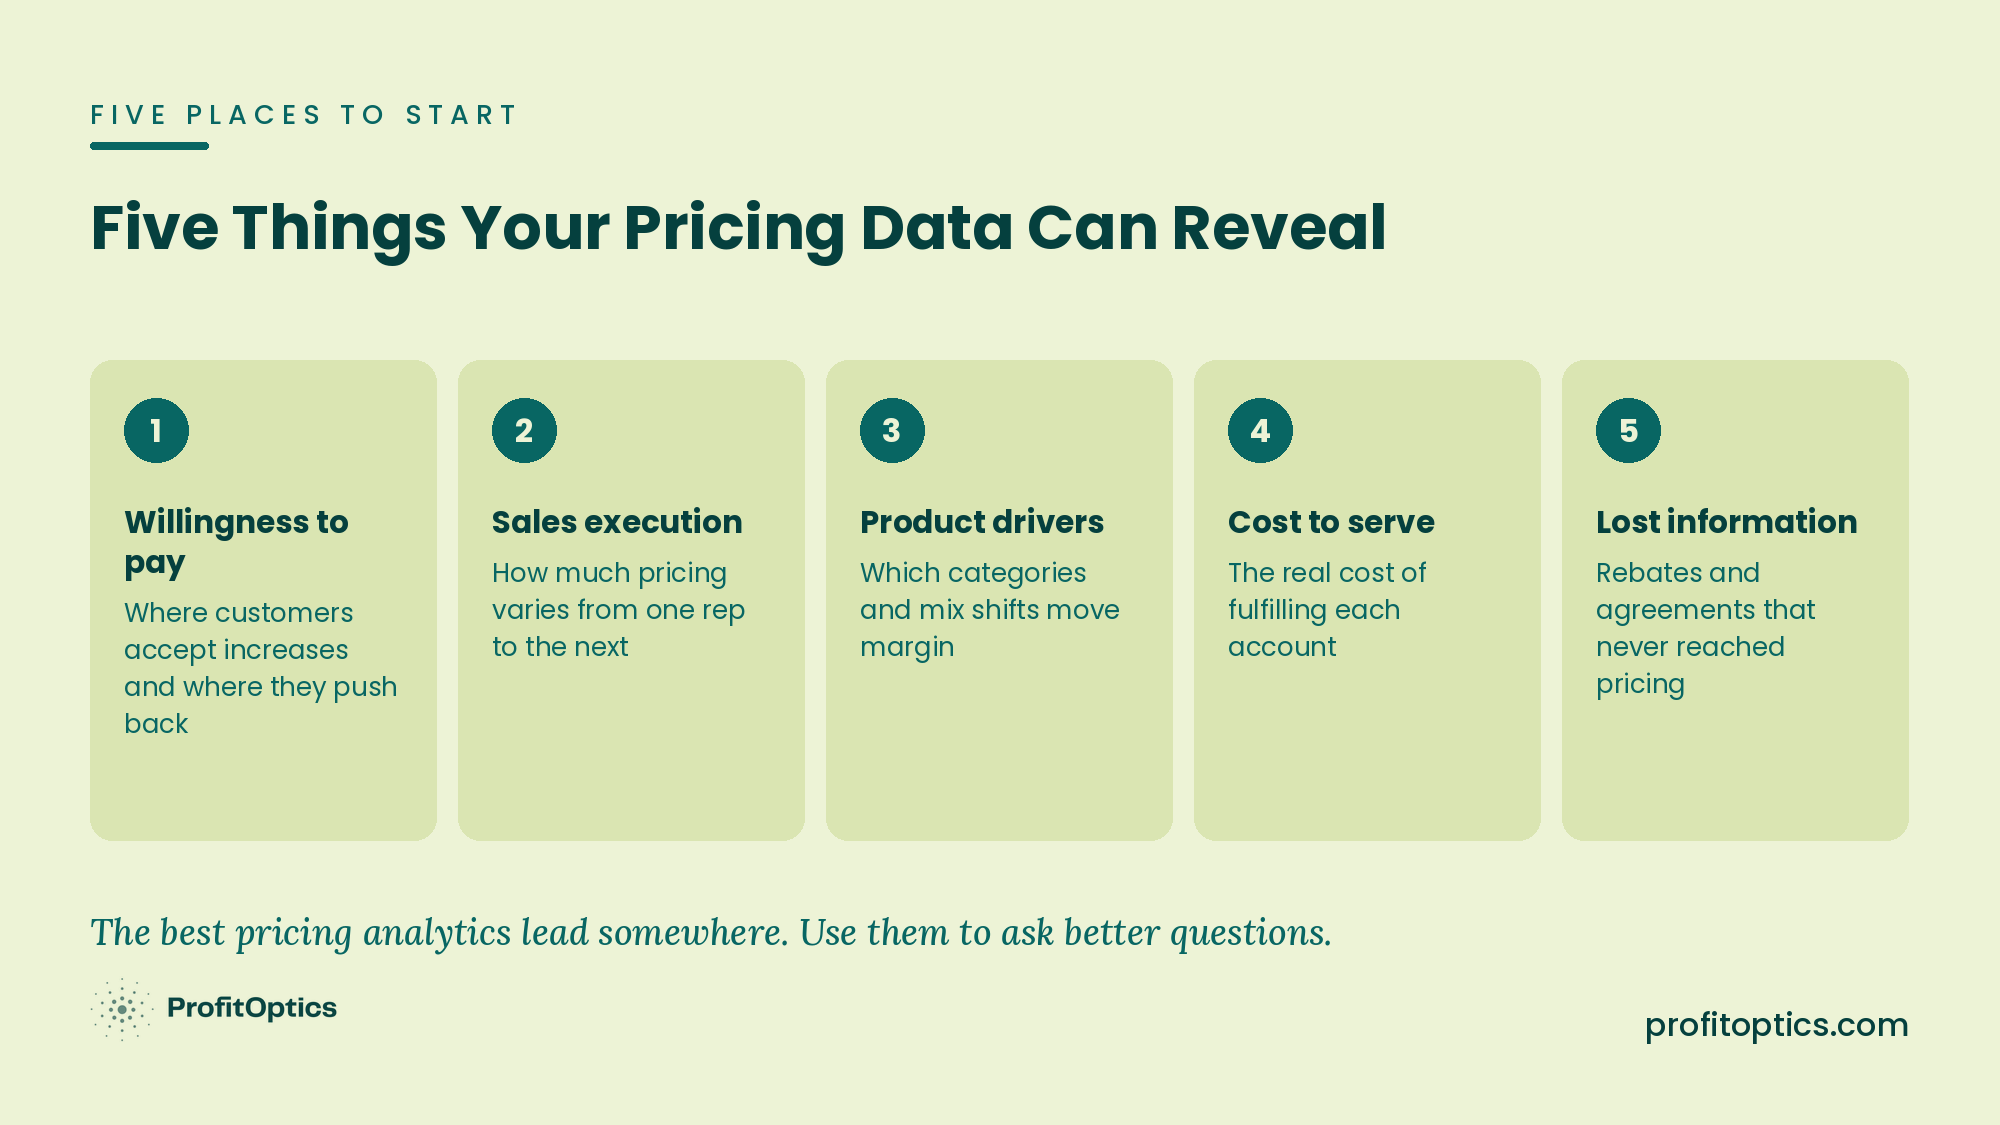
Start with one of the most direct sources of intelligence in your pricing data: how customers respond to price.
Value-based pricing depends heavily on understanding a customer's willingness to pay, which is one reason customer segmentation plays such a large role. But your segments and pricing strategy are still based on assumptions about customer behavior. Actual transactions let you test those assumptions.
Look at where customers accept increases and where they push back. Compare the guidance sales receives with the prices reps negotiate. Pay attention to the customers that regularly require exceptions, as well as those where pricing holds with little resistance.
Over time, those patterns can tell you whether customers are behaving the way you expected when you built your segmentation and pricing strategy. They may also reveal places where you're unnecessarily giving up margin or where a segment needs another look.
If you have 250 sales reps, you may have 250 pricing strategies, as I shared recently for Distribution Strategy Group.
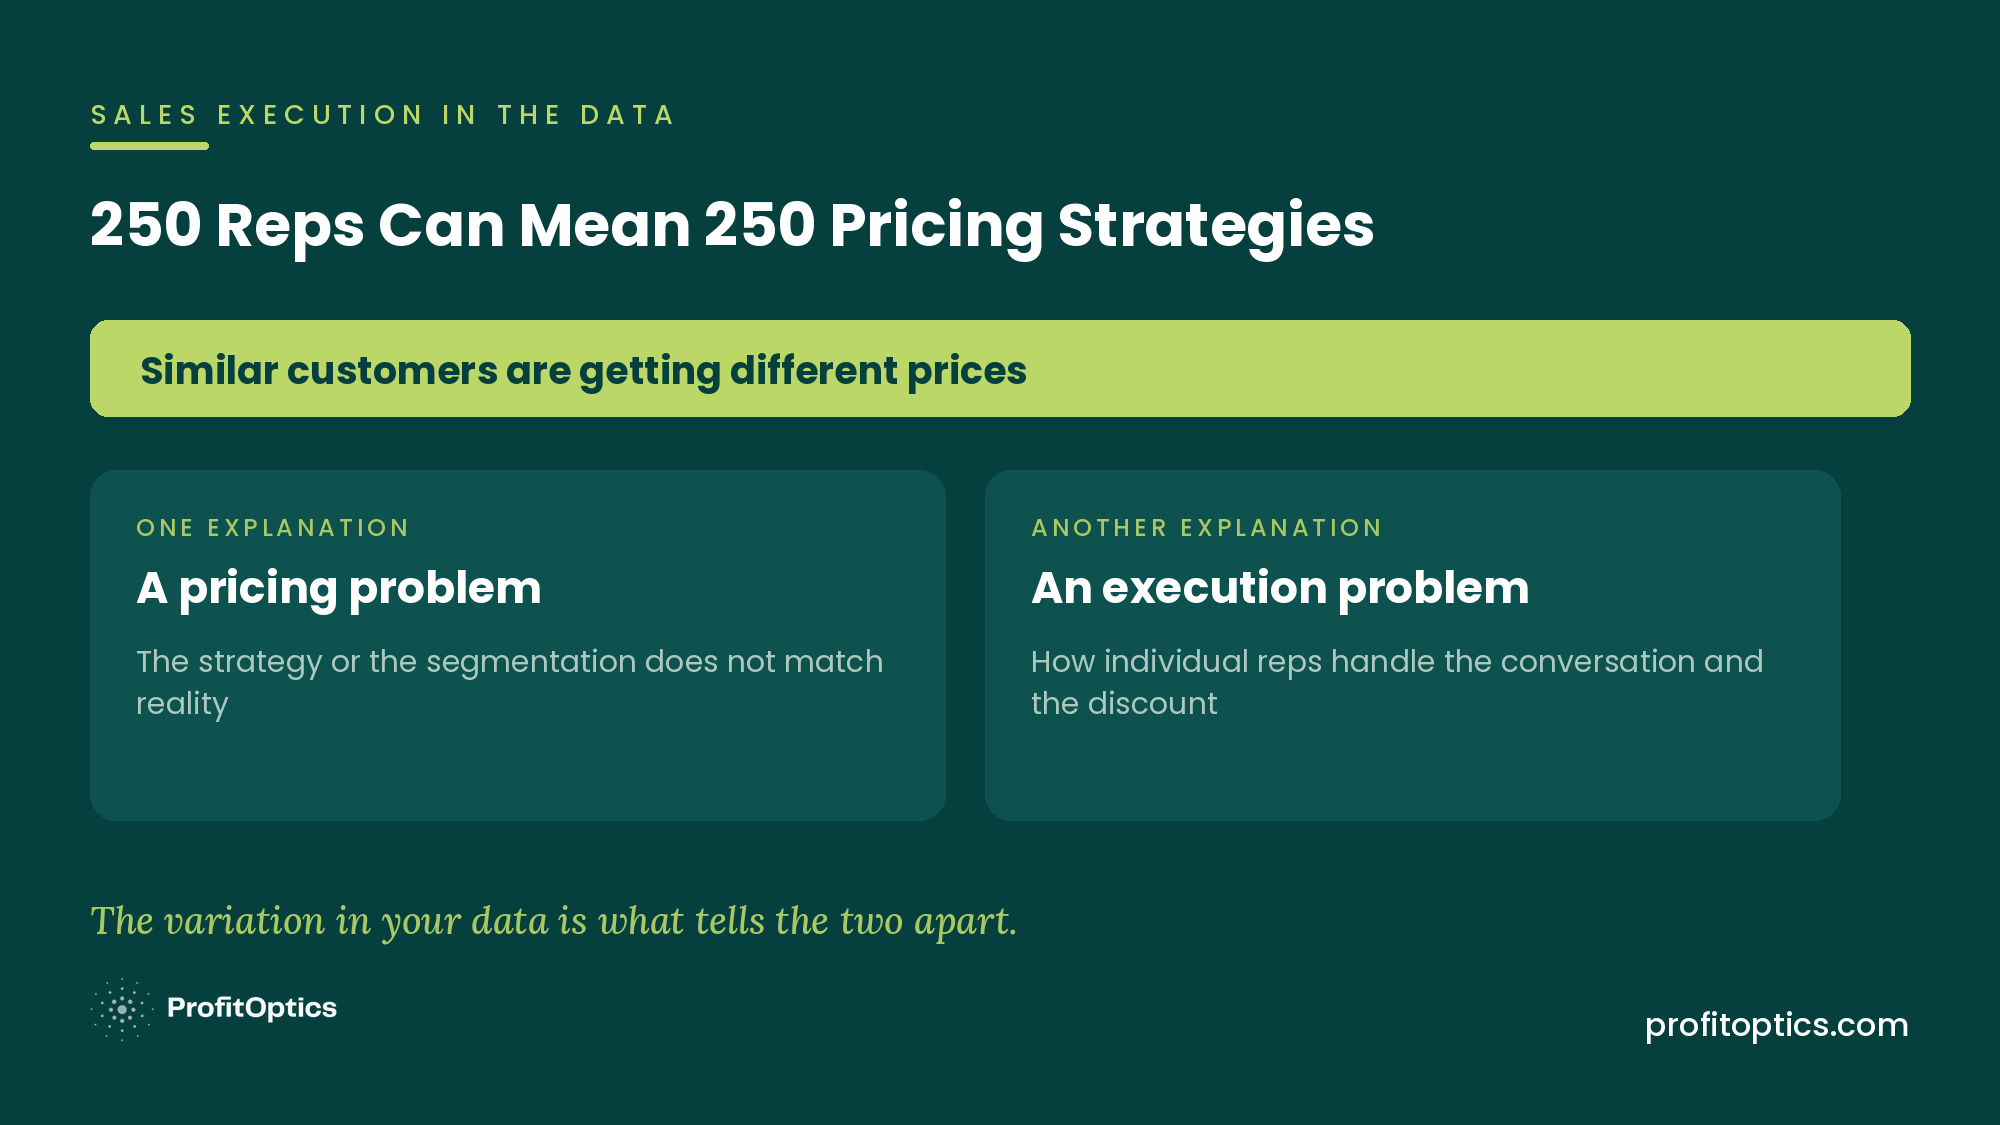
Your pricing data gives you a way to see how much variation exists. Look across reps, customers, and product categories at overrides, exceptions, discounting, and realized prices. You may find that one sales rep routinely discounts where other reps are holding the price. You could also find a cluster of exceptions in a specific customer segment.
On the other hand, sales reps may be successfully holding prices in situations where you thought customers would push back.
That information can help you distinguish between a pricing problem and an execution problem. If similar customers are receiving different prices, for example, the difference may have more to do with how individual reps approach the conversation than with what those customers are willing to pay. (Learn about creating safe zones for your sales reps, which can give them confidence in pricing and help you build a scalable pricing foundation.)
The data can also challenge what you think you know about the customer relationship. A customer may tell a sales rep that you have all its business in a particular product category. But when you look at purchasing patterns, you may find that you’re more likely capturing much less based on other customers’ behavior in the segment. You now have a reason to look for where that business is going and whether there’s an opportunity to win more of it.
A margin number can tell you how your business performed. Breaking that number down by product and category can help explain what drove the result. I remember doing that analysis during COVID and seeing just how many masks we had sold at the distributor I worked for back then.
The volume was much higher than I realized, and once I saw it, I had a much better explanation for what was happening in our growing margins.
With pricing analytics, you can start with the financial result and keep slicing the data to understand what’s underneath it. Maybe a category grew much faster than the rest of the portfolio, or your mix shifted toward higher- or lower-margin products.
Customers may have also started choosing different products than in the past. Product alternatives are a good example. If customers are moving from one product to a comparable substitute or private-label option, the pricing data can show whether those alternatives are gaining traction and what that is doing to margin.
Now you have information merchandising and procurement can use to understand where demand is moving, sales can use when deciding which alternatives to offer, and finance can use to understand what is driving changes.
Two customers may generate similar revenue, but one places larger orders that go out on a single weekly delivery, while the other places smaller orders that require multiple trips. The cost of serving these accounts is very different.
This reality was brought sharply into view over the past year as fuel costs continued to rise.
Instead of looking only at what you charged and what the product cost, start asking what it costs to fulfill the business:
Once you account for these costs, are you producing the margin you expected?
That doesn’t always mean raising the price. Sometimes the better answer is to change the behavior that is creating the cost. If a customer receives two deliveries a week, for example, could you consolidate those into a larger delivery to improve the economics for the distributor without adding a fuel surcharge?
When you have the data, you can bring this into a customer conversation, showing the impact of order size or delivery frequency and working with the customer on a change that can make the account better to serve for everyone.
Pricing data, in other words, can help identify the cost you need to recover and the operational decisions that could reduce it in the first place.
Pricing depends on information across the business. Supplier cost changes, rebates, customer agreements, price locks, purchasing decisions, inventory, and sales negotiations can all affect the price a customer should receive.
The pricing team, however, doesn’t always have the full picture. As we’ve written before, distributors often have the data needed to make a better pricing decision, but it sits across different systems and functions.
Let’s say a supplier announces a cost increase. Pricing starts working out how much of that increase needs to be passed along to customers. But purchasing may have negotiated price protection or a rebate that offsets some or all the increase. If that information hasn't made its way to pricing, the team could push through an increase based on a cost the company isn't absorbing.
Looking back can uncover these disconnects. If a price change produces a result you didn't expect, dig into the inputs behind it. You may find an agreement that wasn't accounted for, a supplier program another team knew about, or a cost change that took effect at a different time than expected.
The best pricing reports make you want to know why margin went up or down. What drove the change? Was it price, volume, product mix, cost, customer behavior, or something else?
Is it an isolated change, or part of a pattern that deserves attention?
I’ve always enjoyed the analytical side of pricing for this reason. You can start to understand what drove the company’s results, and understanding that ideally leads to an action somewhere in the business. So, don’t let a pricing report end with just a number.
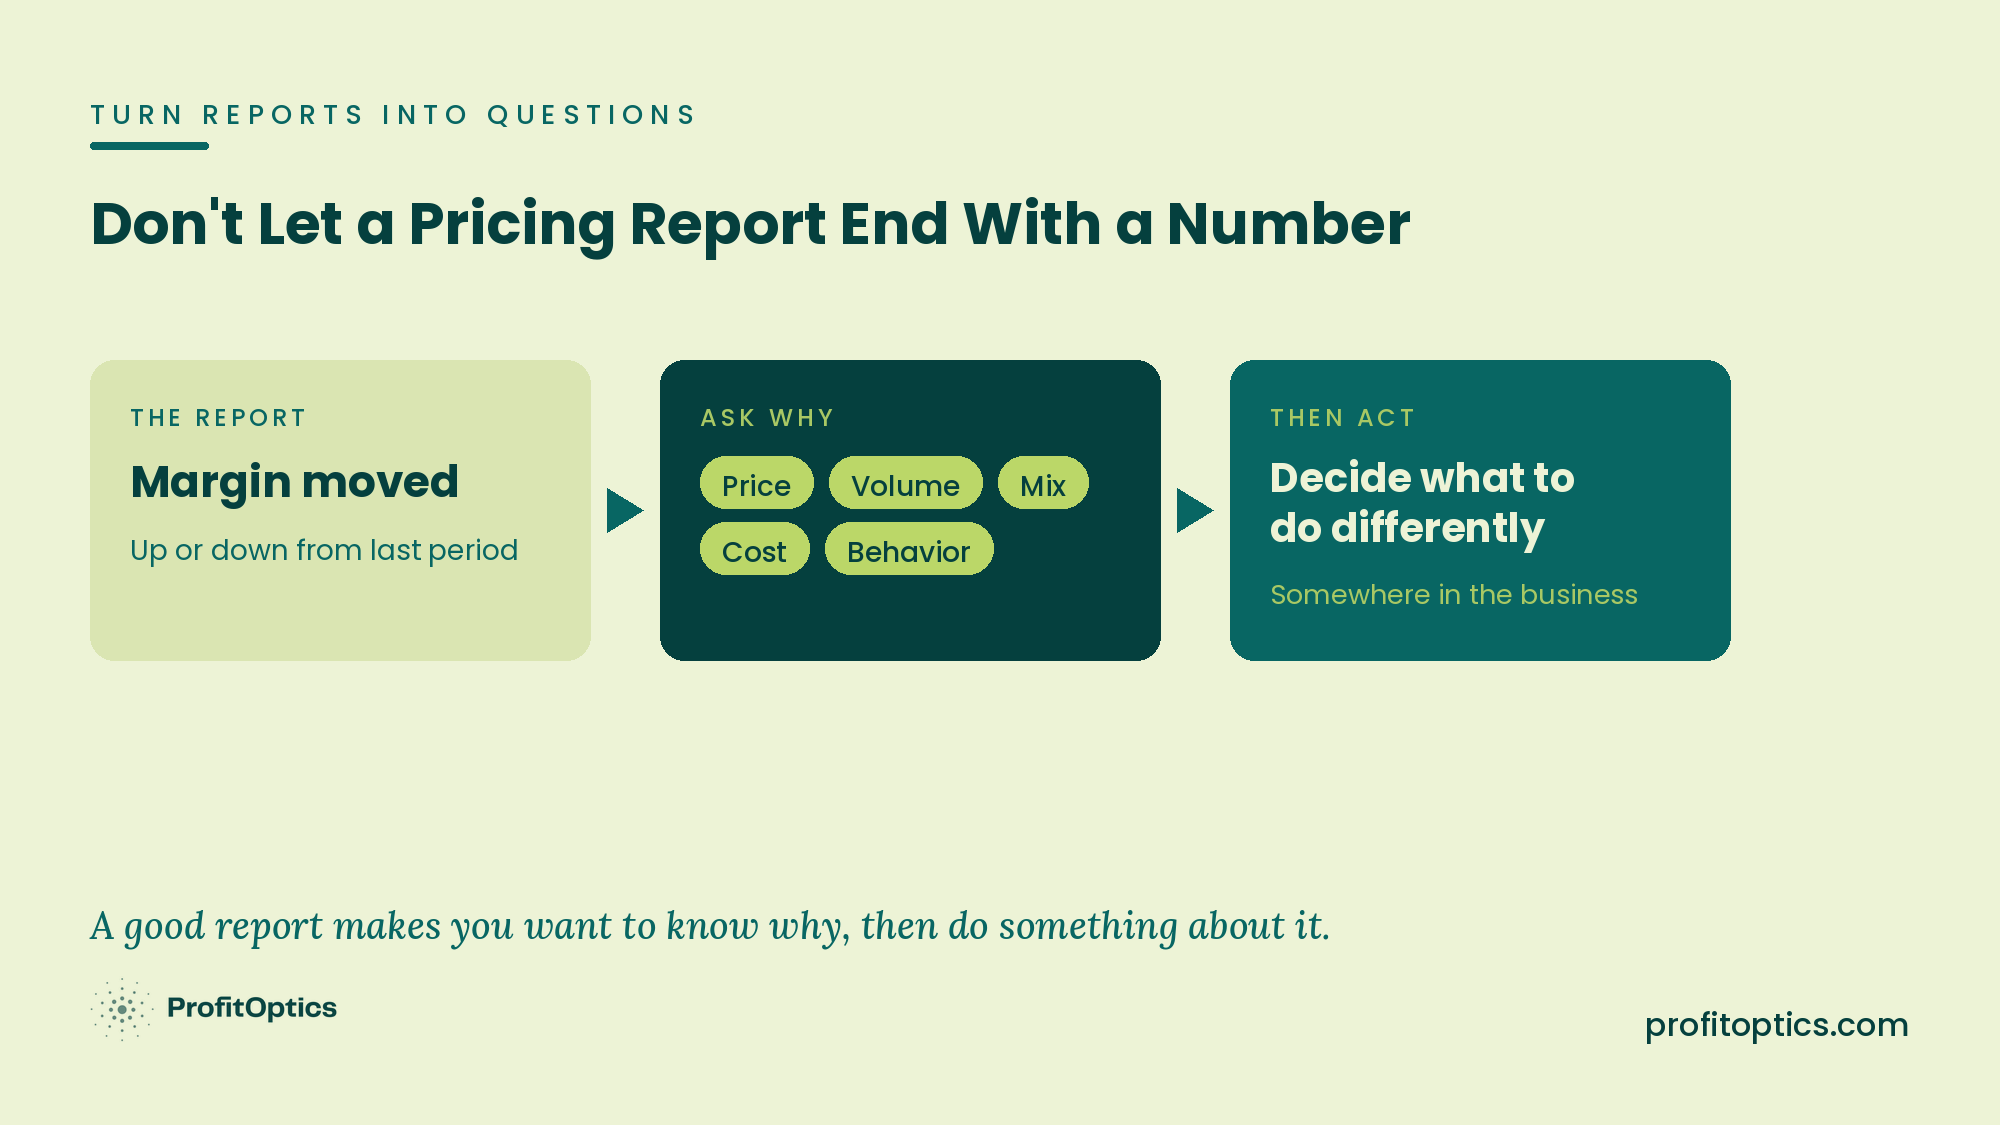
Use it decide where to look next, and what, if anything you should do differently.
And if you’re sitting on pricing data but don’t have an easy way to get those answers from it, that’s a conversation we’re always happy to have. Learn more about how we approach profit improvement or reach out today.